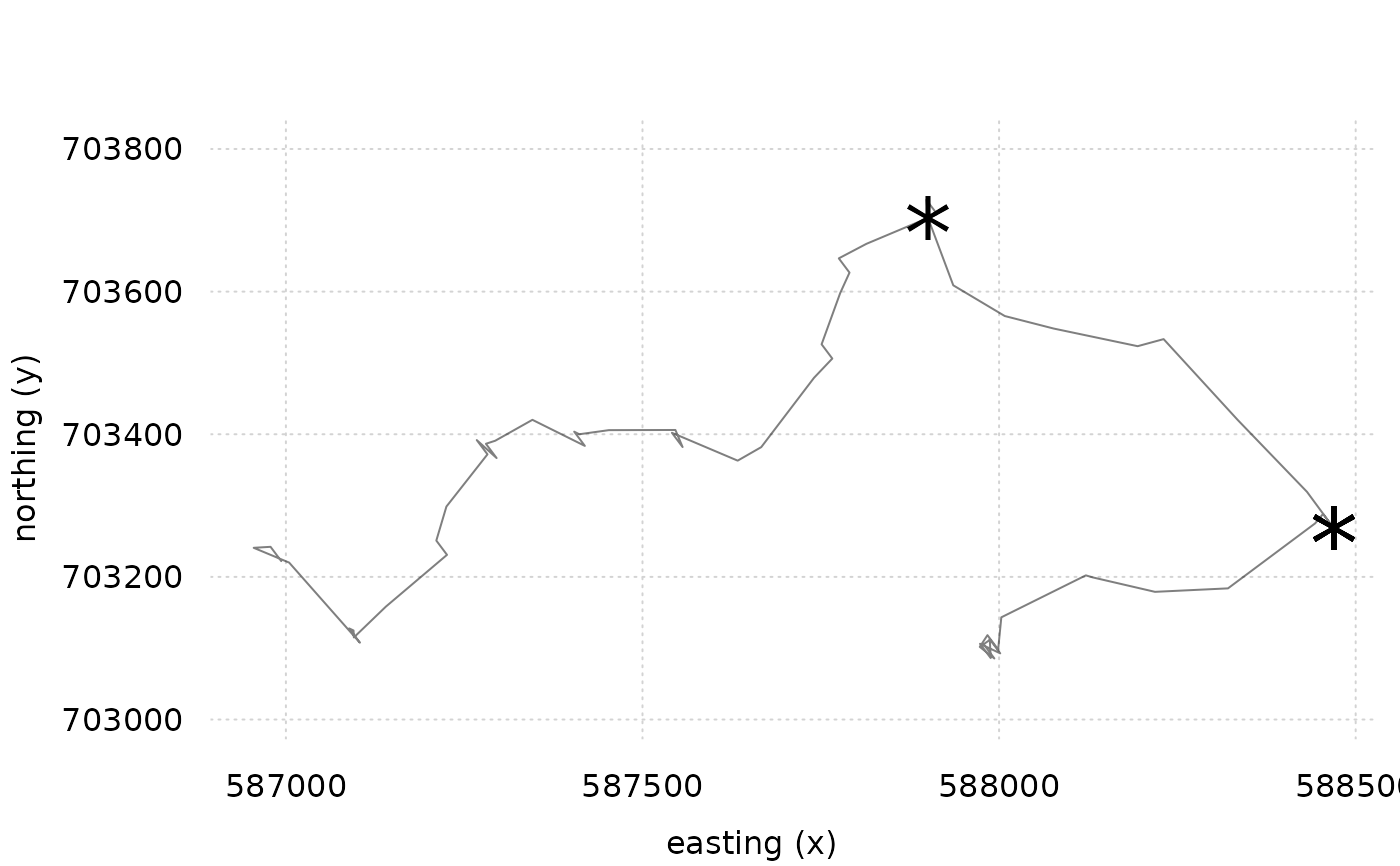
Plot Change point test output
plot.change_point_test.RdPlots change points of objects of class change_point_test
based on tinyplot functionality.
# S3 method for class 'change_point_test'
plot(
  x,
  cp_style = list(col = "black", cex = 3, pch = "*"),
  lines = TRUE,
  lines_style = list(col = "black"),
  points = FALSE,
  points_style = list(pch = 19),
  start_indicator = TRUE,
  start_indicator_style = list(col = "green"),
  end_indicator = TRUE,
  end_indicator_style = list(col = "red"),
  facet = TRUE,
  facet.args = list(),
  theme = NULL,
  asp = 1,
  ...
)
Arguments
- x
an object of class
change_point_test- cp_style
list graphical parameters to apply to change points
- lines
logical should lines be plotted?
- lines_style
list of graphical parameters passed to [tinyplot::tinyplot()] when plotting lines
- points
logical should track data be plotted as points?
- points_style
graphical parameters passed to [tinyplot::tinyplot()] when plotting points
- start_indicator
logical indicator if arrows indicating start point of each track should be added
- start_indicator_style
list of graphical parameters for start indicator. See section 'x_indicator_style'.
- end_indicator
logical indicator if arrows indicating endpoint of each track should be added
- end_indicator_style
list of graphical parameters for end indicator. See section 'x_indicator_style'.
- facet
logical should the plot be facetted by track?
- facet.args
list of arguments controlling facet behavior. If `ncol` is unspecified, an attempt is made chose a visually pleasing value. See
tinyplot- theme
character or list: 1) `NULL` (default): Use currently set `tinyplot` theme if one is set. Otherwise use trackframe default. 2) a string naming a built-in tinyplot theme `vignette("themes", package = "tinyplot")` or 3) a list of graphical parameters defining a custom theme
- asp
numeric y/x aspect ratio
- ...
additional graphical parameters passed to
tinyplot
Details
all args passed on to [plot::trackframe] (`cp_style“ passed as `marker_style`) This method exists to provide different defaults
Examples
library(cpt)
library(trackframe)
library(tinyplot)
data("cpttestdata")
data <- trackframe::as.trackframe(cpttestdata, crs = NA)
class(data)
#> [1] "trackframe" "data.frame"
tinytheme("clean2")
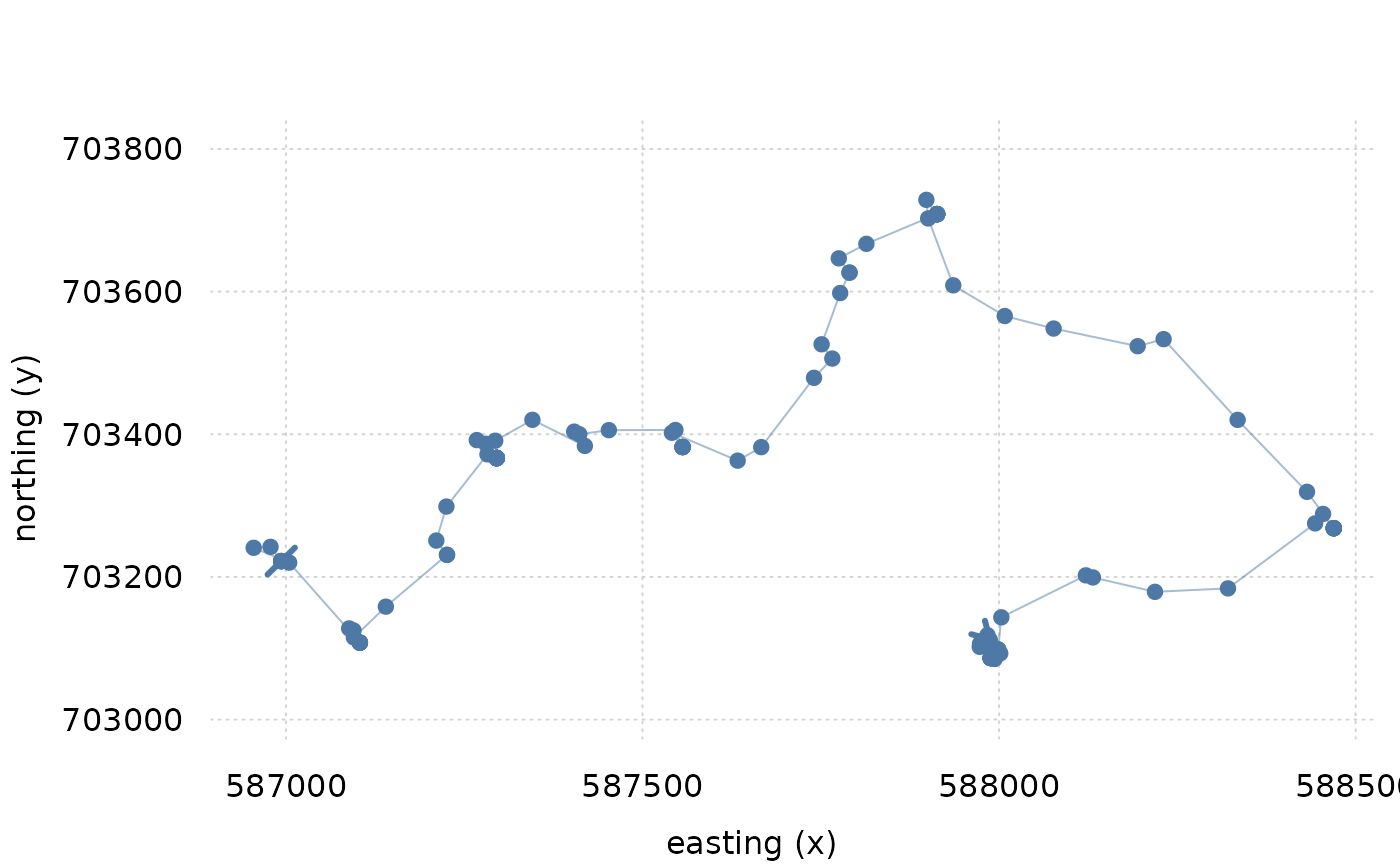
plot(data)
 # single track
plot(select_id(data, "track_1"))
# calculate change points
cpt <- change_point_test(data, alpha = .01, n = 10000, q = 6)
class(cpt)
#> [1] "change_point_test" "trackframe" "data.frame"
plot(cpt)
# single track
plot(select_id(data, "track_1"))
# calculate change points
cpt <- change_point_test(data, alpha = .01, n = 10000, q = 6)
class(cpt)
#> [1] "change_point_test" "trackframe" "data.frame"
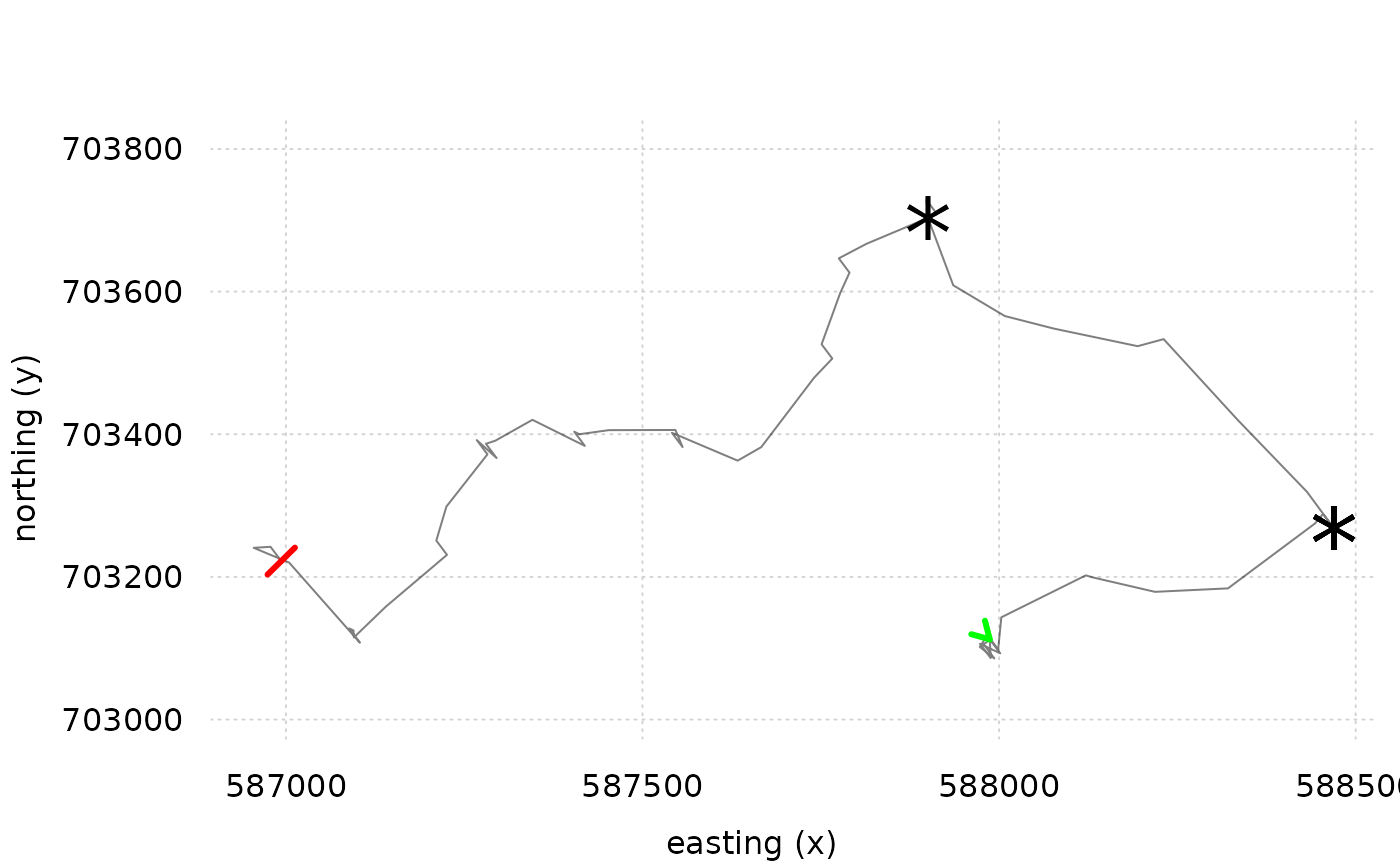
plot(cpt)
 # without path directions
plot(cpt, start_indicator = FALSE, end_indicator = FALSE)
# only one track
cpt1 <- select_id(cpt, "track_1")
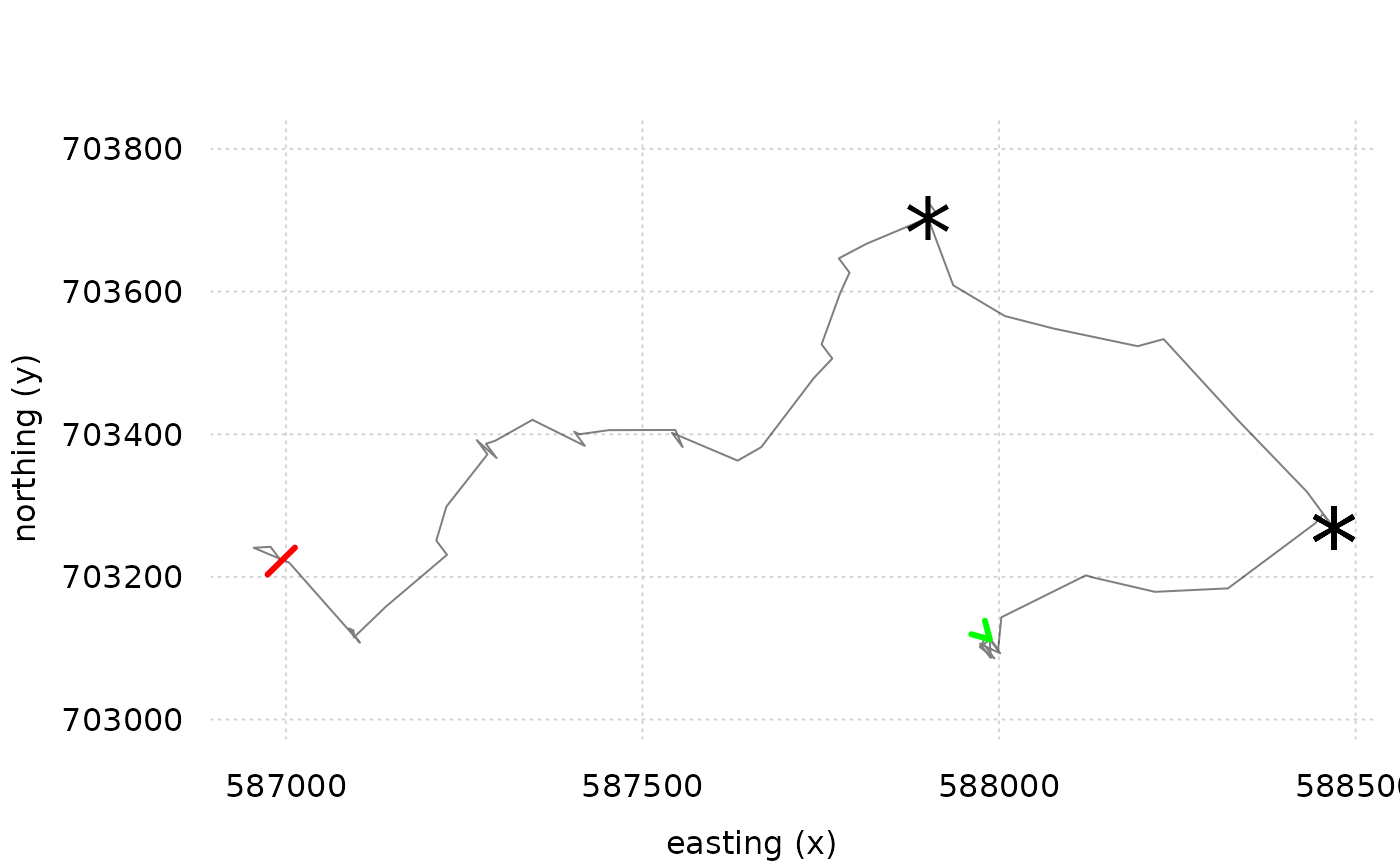
plot(cpt1)
# without path directions
plot(cpt, start_indicator = FALSE, end_indicator = FALSE)
# only one track
cpt1 <- select_id(cpt, "track_1")
plot(cpt1)
 # without path direction
plot(cpt1, start_indicator = FALSE, end_indicator = FALSE)
# without path direction
plot(cpt1, start_indicator = FALSE, end_indicator = FALSE)